ESG Data
- Independent Assurance
- Climate Change Performance Data
- Pollution Prevention and Resource Circulation Performance Data
- Water Resources Performance Data
- Environmental Accounting
Independent Assurance
The data below marked with ★ is independently assured by Deloitte Tohmatsu Sustainability Co., Ltd. This assurance is conducted in accordance with the International Standard on Assurance Engagements (ISAE) 3000 and 3410 of the International Auditing and Assurance Standards Board (IAASB).
Scope of Aggregation
○:in scope of aggregation
| Japanese Bases of ITOCHU Corporation*1 | Group Companies in Japan*2 | Overseas Offices*3 | Overseas Group Companies*4 | |||
| Climate Change | Energy Consumption | Energy Consumption | ○ |
- |
- |
- |
| Energy Consumption Attributable to Business Facilities | ○ |
- |
- |
- |
||
| Electricity Consumption | ○ |
○ |
○ |
○ |
||
| Heat & Steam Consumption | ○ |
○ |
○ |
○ |
||
| Fuel Consumption | ○ |
○ |
○ |
○ |
||
| Energy Intensity | ○ |
- |
- |
- |
||
| GHG Emission | Scope1/Scope2 | ○ |
○ |
○ |
○ |
|
| GHG Emissions from Business Facilities | ○ |
○ |
○ |
○ |
||
| Scope1 Total Emissions Breakdown by GHG Type | ○ |
○ |
○ |
○ |
||
| Scope3 | ○ |
○ |
○ |
○ |
||
| GHG Emissions (Scope1+2) Intensity | ○ |
○ |
○ |
○ |
||
| Prevention of Pollution & Resource Circulation | Prevention of Pollution | NOx, SOx, VOC | ○ |
○ |
○ |
○ |
| Resource Circulation | Waste & Waste Recycling Rate | ○ |
○ |
○ |
○ |
|
| Hazardous Waste | ○ |
○ |
○ |
○ |
||
| Paper Consumption | ○ |
- |
- |
- |
||
| Water Resources Conservation | Water Withdrawal and Wastewater Discharge | Volume of Water Withdrawal & Wastewater Discharge, Water Withdrawal Amount by Withdrawal Source, Discharge Amount by Discharge Destination, Water Withdrawal in Water Stressed Regions, Water Consumption in Manufacturing Processes that are Highly Dependent on Water Resources (Intensity), Biochemical Oxygen Demand (BOD), Chemical Oxygen Demand (COD) | ○ |
○ |
○ |
○ |
| Environmental Accounting | Environmental Conservation Costs, Environmental Conservation & Economic Effects | ○ |
- |
- |
- |
|
- The Tokyo Headquarters, the Osaka Headquarters, 5 Branches (Hokkaido, Tohoku, Chubu, Chugoku and Shikoku, Kyushu).
The number of offices including domestic branches: FY2021: 8, FY2022: 6, FY2023: 6, FY2024: 6, FY2025: 3 (Data coverage at the end of FY2025: 100%).
Ippeki Villa Area is not included in the scope of the data FY2022 due to business transfer during the fiscal period. - The number of companies covered: FY2021: 233, FY2022: 225, FY2023: 241, FY2024: 241, FY2025: 265 (Data coverage at the end of FY2025: 100%)*5.
- The number of overseas offices covered: FY2021: 46, FY2022: 43, FY2023: 43, FY2024: 41, FY2025: 82 (Data coverage at the end of FY2025: 100%).
- The number of companies covered: FY2021: 254, FY2022: 257, FY2023: 261, FY2024: 263, FY2025: 274 (Data coverage at the end of FY2025: 100%)*5.
- In principle, the number of companies covered includes all the subsidiaries. However, GHG emissions, water withdrawal and discharge, and hazardous waste emissions from certain subsidiaries that do not require independent management as standalone entities, as well as water withdrawal and discharge and hazardous waste emissions from non-manufacturing site offices with 10 or fewer employees are not included in the aggregation due to their quantitative insignificance.
Climate Change Performance Data
Energy Consumption
Energy Consumption
| FY2021 | FY2022 | FY2023 | FY2024 | FY2025 | ||
| Japanese Bases of ITOCHU Corporation | Purchased and Consumed Non-Renewable Fuel (Unit: MWh) | 580 |
331 |
156 |
182 |
190 |
| Purchased Non-renewable Power (Unit: MWh) | 27,107 |
26,332 |
22,367 |
22,411 |
22,314 |
|
| Other Purchased Non-renewable Energy (e.g., Steam, Heat and Cooling Water) (Unit: MWh) | 6,869 |
7,046 |
7,993 |
8,371 |
8,540 |
|
| Generated Renewable Energy (Solar Power Generation*1) (Unit: MWh) | 63 |
61 |
66 |
63 |
63 |
|
| Total of Energy Consumption Cost (Unit: million JPY) | 573 |
652 |
612 |
625 |
614 |
|
- Solar Power Generation
ITOCHU has installed solar panels on the roof of our Tokyo Headquarters and the roof of the adjacent Itochu Garden (former CI PLAZA). These panels started generating power in March 2010. The power generation capacity of the solar panels installed is a total of 100 kW. This is equivalent to the power for 30 regular houses (calculated at approximately 3.0 kW per house). All the clean energy generated is used in our Tokyo Headquarters. This is equivalent to an amount of power used in lighting 3.5 floors in our Tokyo Headquarters (during maximum instantaneous power generation)
Energy Consumption Attributable to Business Facilities
(Unit: GJ)
| FY2021 | FY2022 | FY2023 | FY2024 | FY2025 | |
| Tokyo Headquarters | 118,419 |
118,627 |
103,751 |
105,648 |
106,584 |
- The figures for the Tokyo Headquarters had been calculated based on the Tokyo Metropolitan Ordinance on Environmental Preservation until FY2022, and from FY2023 with the emission factors specified in the revised Act on Promotion of Global Warming Countermeasures effective April 1, 2024 (the “Revised Act”)
Electricity Consumption
(Unit: MWh)
| FY2021 | FY2022 | FY2023 | FY2024 | FY2025 | |
| Japanese Bases of ITOCHU Corporation*1 | 10,214 |
9,269 |
9,386 |
9,401 |
9,360 |
| Group Companies in Japan | 1,202,311 |
975,320 |
1,014,274 |
1,052,086 |
1,046,043 |
| Overseas Offices | 3,469 |
3,126 |
3,096 |
3,040 |
2,742 |
| Overseas Group Companies | 422,880 |
538,683 |
645,863 |
777,543 |
787,985 |
| Grand Total of ITOCHU Group | 1,638,874 |
1,526,398 |
1,672,619 |
1,842,070 |
★ 1,846,129 |
- Since January 2020, the Tokyo Headquarters has been sourcing its actual CO2-free electricity along with a FIT Non-Fossil Fuel Certificate
Heat and Steam Consumption
(Unit: GJ)
| FY2021 | FY2022 | FY2023 | FY2024 | FY2025 | ||
| ITOCHU Group | Industrial Steam | 520,936 |
851*1 |
797 |
20,191 |
18,805 |
| Non-industrial Steam | 14,532 |
14,593 |
15,636 |
17,323 |
16,546 |
|
| Hot Water | 6,285 |
4,745 |
4,373 |
3,868 |
4,364 |
|
| Cold Water | 62,874 |
22,353*2 |
25,420 |
26,759 |
25,730 |
|
- In FY2022, a Group company became non-consolidated subsidiaries and is not included in the calculation, which causes significant decrease from FY2021.
- Decreased in FY2022 due to sales of some business sites of a Group company.
Fuel Consumption
| FY2021 | FY2022 | FY2023 | FY2024 | FY2025 | |||
| ITOCHU Group | Kerosene (Unit: kL) | 3,086 |
2,151 |
1,944 |
1,920 |
1,346 |
|
| Light Oil (Unit: kL) | 46,262 |
48,762 |
42,671 |
46,656 |
69,162 |
||
| Gasoline (Unit: kL) | 11,547 |
11,619 |
11,751 |
11,081 |
14,526 |
||
| Heavy Oil A (Unit: kL) | 58,137 |
19,292 |
19,324 |
18,389 |
20,493 |
||
| Heavy Oil B and C (Unit: kL) | 13,595 |
20,784 |
13,959 |
13,614 |
14,742 |
||
| Coal (Unit: t) | 292,371 |
192,663 |
180,851 |
191,625 |
196,924 |
||
| Petroleum gas | Liquefied Petroleum Gas (LPG) (Unit: t) | 13,575 |
14,661 |
13,350 |
12,687 |
11,727 |
|
| Liquefied Petroleum Gas (LPG) (Unit: thousand m3) | 1,200 |
578 |
1,409 |
1,276 |
778 |
||
| Liquefied Petroleum Gas (LPG) (Unit: kL) | 660 |
564 |
1,283 |
1,151 |
2,281 |
||
| Petroleum Hydrocarbon Gas (Unit: thousand m3) | 3 |
3 |
3 |
1 |
0 |
||
| Combustible Natural Gas | Liquefied Natural Gas (LNG) (Unit: t) | 11,654 |
2,534 |
4,540 |
5,483 |
4,629 |
|
| Other Combustible Natural Gas (Unit: thousand m3) | 7,101 |
27,749 |
28,035 |
50,215 |
42,761 |
||
| City Gas, etc. | City Gas (Unit: thousand m3) | 37,107 |
33,931 |
28,688 |
31,738 |
30,797 |
|
| Other Gas (Unit: thousand m3) | 0 |
0 |
0 |
0 |
0 |
||
Energy Intensity
Energy Consumption from ITOCHU’s Domestic Sites (Intensity)
| FY2021 | FY2022 | FY2023 | FY2024 | FY2025 | |
| Per Employee (Total of Japanese Bases of ITOCHU Corporation) (Unit: GJ/employee) |
15.245 |
14.418 |
14.931 |
15.179 |
15.42 |
| Per One Square Meter of All Floor Space (Total of Japanese Bases of ITOCHU Corporation) (Unit: GJ/m2) |
0.564 |
0.539 |
0.559 |
0.580 |
0.588 |
- The denominators of intensity figures per one square meter of all floor space are as follows: FY2021: 113,434 m2, FY2022: 111,945 m2, FY2023: 111,893 m2, FY2024: 110,224 m2, FY2025: 110,026 m2
GHG Emissions
Scope1/Scope2
(Unit: thousand t-CO2e)
| FY2021 | FY2022 | FY2023 | FY2024 | FY2025 | ||
| Japanese Bases of ITOCHU Corporation | Scope1 | 0 |
0 |
0 |
0 |
★ 0 |
| Scope2 | 6 |
6 |
2 |
2 |
★ 2 |
|
| Scope1+2 | 6 |
6 |
2 |
2 |
★ 2 |
|
| ITOCHU Group | Scope1 | 1,485 |
1,166 |
1,062 |
1,087 |
★ 1,162 |
| Scope2 | 716 |
600 |
627 |
640 |
★ 699 |
|
| Scope1+2 | 2,201 |
1,766 |
1,690 |
1,726 |
★ 1,861 |
|
- GHG emissions are calculated and aggregated with reference to the GHG Protocol and the operational control approach, which were developed under the leadership of the World Resources Institute (WRI) and the World Business Council for Sustainable Development (WBCSD).
GHG emissions quantification is subject to uncertainty when measuring activity data, determining emission factors, and considering scientific uncertainty inherent in the Global Warming Potentials.
GHG Emissions from Business Facilities (Scope1+2)
(Unit: thousand t-CO2e)
| FY2021 | FY2022 | FY2023 | FY2024 | FY2025 | |
| Tokyo Headquarters | 6 |
6 |
2 |
2 |
2 |
| Japanese Bases of ITOCHU Corporation | 6 |
6 |
2 |
2 |
★ 2 |
| Group Companies in Japan | 1,507 |
1,133 |
1,111 |
1,134 |
1,131 |
| Overseas Offices | 3 |
3 |
3 |
3 |
3 |
| Overseas Group Companies | 684 |
625 |
573 |
587 |
726 |
| Grand Total of ITOCHU Group | 2,201 |
1,766 |
1,690 |
1,726 |
★ 1,861 |
- Energy-related CO2 emissions included in the ITOCHU Group’s Scope1 emissions are calculated by applying the emission factors specified in the Act on Promotion of Global Warming Countermeasures. Until FY2022, CO2 emissions had been calculated using emission factors before the enforcement of the Revised Act, and from FY2023 with the emission factors specified in the Revised Act. However, CO2 emissions from city gas had been calculated by applying the emission factors (City gas: 2.23 t-CO2/thousand m3N) that were effective prior to the enforcement of the Revised Act until FY2023, and FY2025 was calculated with the emission factors by gas utility published by the Ministry of the Environment and the Ministry of Economy, Trade and Industry as of June 30, 2025.
- CO2 emissions from electric power generation of Japanese Bases of ITOCHU Corporation and Group Companies in Japan are calculated by applying basic emission factors by electric utility for data up to FY2020 and adjusted emission factors by electric utility for data from FY2021 and onward. The data for FY2025 is based on the adjusted emission factors for each electric utility published by the Ministry of the Environment on January 9, 2026.
- CO2 emissions from electricity of Overseas Offices and Overseas Group Companies are calculated based on CO2 emission coefficient according to the Emission Factors 2025 of the International Energy Agency (IEA 2025). We used 2023 data from IEA 2025 for calculating the figures for FY2025. However, when specific emission factors provided by electricity suppliers are available, those factors are used instead.
- CO2 emissions from heat (Non-industrial Steam, Hot Water, and Cold Water) had been calculated using emission factors (Non-industrial Steam, Hot Water, and Cold Water: 0.057 t-CO2/GJ) that were effective prior to the enforcement of the Revised Act until FY2023, and FY2025 was calculated with the emission factors by heat supplier as of June 30, 2025.
- The figures for the Tokyo Headquarters had been calculated based on the Tokyo Metropolitan Ordinance on Environmental Preservation until FY2022, and from FY2023 with the emission factors specified in the Revised Act.
- CO2 emissions in FY2025 that are not included in any of the Scope1,2 and 3 emissions are 434 thousand t-CO2e, which are CO2 emissions from the combustion of biomass fuels such as wood and vegetable residues.
- For FY2025, Scope 1 and 2 emissions for some subsidiaries are calculated using estimated values.
Scope1 Total Emissions Breakdown by GHG Type
(Unit: thousand t-CO2e)
| FY2021 | FY2022 | FY2023 | FY2024 | FY2025 | |||
| Scope1 Total Emissions | 1,485 |
1,166 |
1,062 |
1,087 |
1,162 |
||
| Energy-Related CO2 | 1,214 |
907 |
845 |
902 |
965 |
||
| Total GHG Emissions other than Energy-Related CO2 | 270 |
259 |
218 |
185 |
198 |
||
| Breakdown | Non-Energy-Related CO2 | 0 |
16 |
14 |
16 |
16 |
|
| Methane (CH4) | 136 |
122 |
106 |
83 |
81 |
||
| Dinitrogen Monoxide (N2O) | 108 |
103 |
82 |
72 |
78 |
||
| Hydrofluorocarbon (HFCs) | 26 |
18 |
16 |
14 |
23 |
||
| Perfluorocarbon (PFCs) | 0 |
0 |
0 |
0 |
0 |
||
| Sulfur Hexafluoride (SF6) | 0 |
0 |
0 |
0 |
0 |
||
| Nitrogen Trifluoride (NF3) | 0 |
0 |
0 |
0 |
0 |
||
- The global warming potential (GWP: Global Warming Potential) for the calculation of GHG emissions other than energy-related CO2 is based on GWP100 of the IPCC 4th Assessment Report (AR4) for FY2021-2022, GWP100 of the IPCC 5th Assessment Report (AR5) for FY2023-2025.
- GHG emissions other than energy-related CO2 from Group companies that emit 3,000 or more t-CO2e per year are aggregated and disclosed.
- We started including “CH4 and N2O emissions associated with pig breeding and excrement management” and “HFC emissions due to leaks from refrigerating equipment, etc.” from FY2018, and started further including “CH4 emissions associated with wastewater treatment”, “CH4 emissions associated with composting and landfilling waste” and “N2O emissions associated with the use of fertilizer on farms” from FY2021.
- GHG emissions derived from fluorocarbons are as follows:
- Group Companies in Japan: Calculated according to the calculation method stipulated by Act on Rational Use and Appropriate Management of Fluorocarbons. However, HCFC is not included in the aggregation.
- Overseas Group Companies: Calculated based on the charging amount of fluorocarbons used as refrigerants.
Scope3
(Unit: million t-CO2e)
| FY2021 | FY2022 | FY2023 | FY2024 | FY2025 | |
| 1. Purchased Goods and Services | - |
- |
- |
60 |
Under Calculation |
| 2. Capital Goods | 0.6 |
0.5 |
0.5 |
0.6 |
Under Calculation |
| 3. Fuel & Energy Related Activities not included in Scope1 and Scope2 | 0.3 |
0.3 |
0.3 |
0.3 |
Under Calculation |
| 4. Upstream Transportation & Distribution (Non-consolidated: Domestic contracted transportation where the company acts as the shipper*1) |
0.01 |
0.01 |
0.01 |
0.02 |
★ 0.01 |
| 4. Upstream Transportation & Distribution (Consolidated: Domestic and international transportation arranged by the company and its subsidiaries) |
- |
- |
- |
7 |
Under Calculation |
| 5. Waste Generated in Operations | 0.3 |
0.2 |
0.2 |
0.2 |
Under Calculation |
| 6. Business Travel*2 | 0.03 |
0.04 |
0.1 |
0.1 |
Under Calculation |
| 7. Employee Commuting | 0.02 |
0.02 |
0.03 |
0.03 |
Under Calculation |
| 8. Upstream Leased Asset | - |
- |
- |
Including Scope1, 2 |
Under Calculation |
| 9. Downstream Transportation and Distribution | - |
- |
- |
0.2 |
Under Calculation |
| 10. Processing of Sold Products*3 | - |
- |
- |
16 |
Under Calculation |
| 11. Use of Sold Products | - |
- |
- |
70 |
Under Calculation |
| 12. End-of-life Treatment of Sold Products | - |
- |
- |
2 |
Under Calculation |
| 13. Downstream Leased Assets | - |
- |
- |
0.4 |
Under Calculation |
| 14. Franchises*4 | 1 |
1 |
0.9 |
1 |
Under Calculation |
| 15. Investments*5 | - |
- |
- |
16 |
Under Calculation |
| Total | 2 |
2 |
2 |
175 |
Under Calculation |
The total values of each category and the overall total may not match due to rounding.
- GHG emissions are calculated with reference to the GHG Protocol developed by WRI (the World Resources Institute) and WBCSD (the World Business Council for Sustainable Development). GHG emissions quantification is subject to uncertainty when measuring activity data, determining emission factors, and considering scientific uncertainty inherent in the Global Warming Potentials.
- The scope of aggregation covers ITOCHU Corporation (non-consolidated) and its consolidated subsidiaries.
- Regarding the calculation categories, only Categories 2, 3, 4 (domestic contracted transportation only), 5, 6, 7, and 14 were disclosed up to FY2023. From FY2024, all categories are disclosed.
- The following transactions are excluded from calculation, if applicable:
- Transactions treated as agency transactions in accounting and recognized as agency revenue.
- Transactions with so-called traders where neither the processor nor end-consumer can be identified as the buyer.
- Transactions between companies included within the scope of aggregation.
- Emission factor is selected from the Inventory Database for Calculation of an Organization’s GHG Emissions through the Supply Chain issued by the Ministry of Environment of Japan, the Inventory Database for Environmental Analysis (IDEA) developed by National Institute of Advanced Industrial Science and Technology (AIST), etc.
- Emissions related to domestic contracted transportation of ITOCHU Corporation as the shipper are calculated based on the Greenhouse Gas Emissions Calculation and Reporting Manual issued by the Ministry of the Environment and the Ministry of Economy, Trade and Industry.
- Calculated based on the consolidated accounting data of the ITOCHU Group. The emissions factor is used for each type of business trip. In FY2024, the GHG reduction effect of 100 t-CO2e was included applying “Certificate of CO2 Reduction Effect by SAF” which we purchased through “SAF Flight Initiative” offered by All Nippon Airways Co., Ltd.
- For processing of sold intermediate products, calculations are included if the downstream use can be identified and the emissions from the processing process can be reasonably estimated. For iron ore and metallurgical coal (ferrous raw materials), emissions from crude steel production are allocated proportionally by weight.
- The difference between Scope1 and Scope2 of franchisees of related consolidated subsidiaries of the ITOCHU Group and Scope1 and Scope2 of those subsidiaries is calculated.
- For FY2024, only major in-scope affiliates are included in the calculation.
GHG Emissions (Scope1+2) Intensity
GHG (Scope1+2) Emissions from ITOCHU’s Domestic Sites and ITOCHU Group (Intensity)
| FY2021 | FY2022 | FY2023 | FY2024 | FY2025 | |
| Per Employee (Total of Japanese Bases of ITOCHU Corporation) (Unit: t-CO2e/employee) |
1.540 |
1.439 |
0.468 |
0.437 |
0.474 |
| Per One Square Meter of All Floor Space (Total of Japanese Bases of ITOCHU Corporation) (Unit: t-CO2e/m2) |
0.057 |
0.054 |
0.018 |
0.017 |
0.018 |
| Per MWh of Electricity Consumption (Grand Total of ITOCHU Group) (Unit: t-CO2e/MWh) |
0.437 |
0.393 |
0.375 |
0.347 |
0.379 |
- The denominators of intensity figures per one square meter of all floor space are as follows: FY2021: 113,434 m2, FY2022: 111,945 m2, FY2023: 111,893 m2, FY2024: 110,224 m2, FY2025: 110,026 m2
CO2 Emissions by Beverage Manufacturing Companies (Intensity)
| Business Profile | Company Name (Boundary) | Unit | FY2021 | FY2022 | FY2023 | FY2024 | FY2025 |
| Beverage Manufacturing | Clear Water Tsunan Co., Ltd. |
t-CO2e/ |
0.080 |
0.073 |
0.073 |
0.061 |
0.062 |
Avoided Emissions
Avoided emissions is a quantification of the amount of GHG emissions that could be reduced or prevented across the value chain by replacing conventional products and services with those that have lower emissions. International discussions are continuing on the calculation rules for avoided emissions in order to establish a system that is more in line with the actual situation. We will continue to review our own calculation and disclosure methods in light of these discussions.
| Valuation Target | FY2025 | Baseline | Calculation Method |
| Renewable Energy Power Generation | 12,863 thousand t-CO2e |
Coal-fired Power Generation in Each Country |
|
| Energy Storage | 368 thousand t-CO2e |
Coal-fired Power Generation in Each Country |
|
| Renewable Fuel | 9 thousand t-CO2e |
Fossil Fuel |
|
Pollution Prevention and Resource Circulation Performance Data
Pollution Prevention
NOx, SOx, VOC
(Unit: t)
| FY2021 | FY2022 | FY2023 | FY2024 | FY2025 | ||
| Japanese Bases of ITOCHU Group*1 | NOx (Nitrogen Oxides)*2 | 1,437 |
1,108 |
982 |
986 |
★ 1,070 |
| SOx (Sulfur Oxides)*2 | 416 |
370 |
298 |
347 |
★ 335 |
|
| VOC (Volatile Organic Compounds)*3 *4 | 400 |
219 |
312 |
376 |
★ 349 |
|
| Overseas Bases of ITOCHU Group | NOx (Nitrogen Oxides)*2 | 1,656 |
131 |
65 |
122 |
162 |
| SOx (Sulfur Oxides)*2 | 545 |
284 |
235 |
521 |
243 |
|
| VOC (Volatile Organic Compounds)*3 | 192 |
222 |
215 |
3,676 |
3,759 |
|
| Grand Total of ITOCHU Group | NOx (Nitrogen Oxides)*2 | 3,093 |
1,239 |
1,047 |
1,109 |
1,232 |
| SOx (Sulfur Oxides)*2 | 961 |
653 |
534 |
869 |
578 |
|
| VOC (Volatile Organic Compounds)*3 *4 | 592 |
441 |
527 |
4,052 |
4,109 |
|
- The data are calculated for the business bases located in Japan.
- NOx and SOx emissions are calculated for soot and smoke generating facilities under the Air Pollution Control Act.
- VOC emissions are calculated for compounds that fall under the VOC 100 types indicated in the notification of the Air Pollution Control Act by the Ministry of the Environment. The main compounds to be counted include ethyl acetate, propyl acetate and isopropyl alcohol. See Attachment 1 of “Enforcement of the Act to Partially Amend the Air Pollution Control Act” (Notice of the Ministry of the Environment, No. 050617001, Kankan Daihatsu, dated June 17, 2005).
- VOC emissions from facilities that are not classified as VOC emission facilities under the Air Pollution Control Act are calculated as the total handling amount of VOCs without taking into account the removal rate, even if the facility is equipped with local exhaust ventilation or similar equipment.
Resource Circulation
Waste Generated and Waste Recycling Rate
| FY2021 | FY2022 | FY2023 | FY2024 | FY2025 | |||
| Tokyo Headquarters | Waste Generated (Unit: t) | 469 |
428 |
451 |
418 |
★ 541 |
|
| Waste Non-recycled | 30 |
39 |
34 |
35 |
★ 39 |
||
| Waste Recycled | 439 |
389 |
417 |
383 |
★ 502 |
||
| Recycling Rate (Unit: %) | 93.7 |
90.9 |
92.5 |
91.7 |
★ 92.7 |
||
| Osaka Headquarters, Branches and Other Business Facilities in Japan | Waste Generated (Unit: t) | 2,265 |
3,160 |
1,722 |
1,168 |
3,741 |
|
| Group Companies in Japan | Waste Generated (Unit: t) | 141,355 |
110,911 |
108,968 |
115,346 |
110,767 |
|
| Overseas Offices | Waste Generated (Unit: t) | 238 |
449 |
412 |
143 |
135 |
|
| Overseas Group Companies | Waste Generated (Unit: t) | 504,296 |
525,187 |
498,016 |
538,249 |
533,993 |
|
| Grand Total of ITOCHU Group | Waste Generated (Unit: t) | 648,623 |
640,135 |
609,568 |
655,324 |
649,148 |
|
| Waste Non-recycled | 194,374 |
132,496 |
141,219 |
109,951 |
99,408 |
||
| Waste Recycled | 454,249 |
507,639 |
468,349 |
545,372 |
549,740 |
||
| Recycling Rate (Unit: %) | 70 |
79 |
77 |
83 |
85 |
||
- The waste generated of the Tokyo Headquarters includes the amount sold as valuables
Hazardous Waste Generated
(Unit: t)
| FY2021 | FY2022 | FY2023 | FY2024 | FY2025 | |
| Japanese Bases of ITOCHU Corporation・Japanese Bases of ITOCHU Group*1 *2 | 251 |
226 |
267 |
384 |
★ 347 |
| Overseas Offices・Overseas Bases of ITOCHU Group | 1,063 |
4,374 |
3,462 |
3,621 |
5,537 |
| Grand Total of ITOCHU Group | 1,314 |
4,600 |
3,730 |
4,004 |
5,884 |
- The data are calculated for the business bases located in Japan.
- The amount of specially controlled industrial waste specified in the “Waste Disposal and Public Cleansing Law” is totaled.
Paper Consumption
(Unit: thousand sheets (A4 equivalent))
| FY2021 | FY2022 | FY2023 | FY2024 | FY2025 | ||
| Japanese Bases of ITOCHU Corporation | Copy Paper Consumption | 14,916 |
14,383 |
12,720 |
12,190 |
10,289 |
Water Resources Performance Data
Water Withdrawal and Wastewater Discharge
Volume of Water Withdrawal & Wastewater Discharge
(Unit: thousand m3)
| FY2021 | FY2022 | FY2023 | FY2024 | FY2025 | ||
| Tokyo Headquarters | City Water Usage | 30 |
37 |
40 |
40 |
44 |
| Treated Water Production Volume*1 | 27 |
32 |
38 |
39 |
★ 34 |
|
| Wastewater Discharge | 41 |
50 |
54 |
55 |
56 |
|
| Osaka Headquarters, Branches and Other Business Facilities in Japan | Water Withdrawal | 84 |
4 |
7 |
6 |
6 |
| Wastewater Discharge | 169 |
6 |
7 |
6 |
6 |
|
| Japanese Bases of ITOCHU Corporation | Water Withdrawal*2 *3 | 115 |
41 |
62 |
61 |
★ 63 |
| Wastewater Discharge*2 *4 | 210 |
56 |
60 |
61 |
★ 62 |
|
| Group Companies in Japan | Water Withdrawal | 25,228 |
14,833 |
15,315 |
16,379 |
15,991 |
| Wastewater Discharge | 14,926 |
9,835 |
9,871 |
10,805 |
10,345 |
|
| Overseas Offices | Water Withdrawal | 31 |
39 |
36 |
22 |
23 |
| Wastewater Discharge | 31 |
39 |
35 |
22 |
22 |
|
| Overseas Group Companies | Water Withdrawal | 32,747 |
30,208 |
35,251 |
33,674 |
34,447 |
| Wastewater Discharge | 16,319 |
14,347 |
13,275 |
10,551 |
11,311 |
|
| Grand Total of ITOCHU Group | Water Withdrawal | 58,120 |
45,121 |
50,663 |
50,136 |
50,524 |
| Wastewater Discharge | 31,486 |
24,277 |
23,241 |
21,438 |
21,740 |
|
- The treated water production volume partly contains “City water usage”.
- In FY2022, water withdrawal and wastewater volume decreased significantly from the previous fiscal year because the business of the Ippeki villa area was transferred during the fiscal year and is not included in the calculation.
- The amount of rainwater used for treated water production has been counted in water withdrawal at the Tokyo Headquarters from FY2023.
- The amount of wastewater discharge from Japanese Bases of ITOCHU Corporation until FY2021 includes wastewater from sewage treatment plants that receive and treat sewage from third parties, so the amount of wastewater greatly exceeds the amount of water withdrawal.
- Water sprayed for irrigation is not included in wastewater discharge.
- Estimation method when water withdrawal and wastewater discharge are not known;
for Water withdrawal: using a certain basic unit.
for Wastewater discharge: assuming the same amount as water withdrawal or using a certain basic unit.
Water Withdrawal Amount by Withdrawal Source
(Unit: thousand m3)
| FY2021 | FY2022 | FY2023 | FY2024 | FY2025 | ||
| ITOCHU Group | Supplied Water Usage, Industrial Water | 11,655 |
11,669 |
12,618 |
14,099 |
13,676 |
| Groundwater Withdrawal | 16,702 |
15,349 |
18,652 |
15,575 |
14,868 |
|
| Water Taken from Rivers, Lakes, Rainwater | 19,729 |
18,079 |
19,340 |
20,427 |
21,932 |
|
| Water Taken from Seawater | 10,015 |
0 |
0 |
0 |
0 |
|
| Others (External wastewater, Produced Water, etc.) | 19 |
25 |
54 |
35 |
47 |
|
| Grand Total | 58,120 |
45,121 |
50,663 |
50,136 |
50,523 |
|
Discharge Amount by Discharge Destination
(Unit: thousand m3)
| FY2021 | FY2022 | FY2023 | FY2024 | FY2025 | ||
| ITOCHU Group | Water Discharged to Treatment Facility (e.g., Sewage) | 9,893 |
7,052 |
7,416 |
7,878 |
7,437 |
| Water Discharged to Groundwater | 6,464 |
3,912 |
4,069 |
1,872 |
1,787 |
|
| Water Discharged to Rivers, Lakes | 12,581 |
10,730 |
9,009 |
8,595 |
9,525 |
|
| Water Discharged to Sea | 1,905 |
1,857 |
2,355 |
3,068 |
2,967 |
|
| Others | 642 |
725 |
392 |
24 |
24 |
|
| Grand Total | 31,486 |
24,277 |
23,241 |
21,438 |
21,740 |
|
Water Withdrawal in Water Stressed Regions
The amount of water withdrawal at sites with high risk and extremely high risk identified using the WRI Aqueduct tool developed by WRI (World Resources Institute) is as follows:
| FY2021 | FY2022 | FY2023 | FY2024 | FY2025 | ||
| High Risk (40-80%) | Number of Sites | 4 |
5 |
8 |
9 |
6 |
| Water Withdrawal (thousand m3) | 2,449 |
2,478 |
139 |
264 |
243 |
|
| Extremely High Risk (>80%) | Number of Sites | 3 |
5 |
7 |
8 |
4 |
| Water Withdrawal (thousand m3) | 1,362 |
1,167 |
3,920 |
1,909 |
1,141 |
|
Water Consumption in Manufacturing Processes that are Highly Dependent on Water Resources (Intensity)
| Category | Boundary | Unit | FY2021 | FY2022 | FY2023 | FY2024 | FY2025 |
| Beverage Manufacturing | Clear Water Tsunan Co., Ltd. |
(Water Consumption m3/Production Volume in kL) |
1.82 |
1.83 |
1.81 |
1.82 |
1.78 |
Biochemical Oxygen Demand (BOD) Chemical Oxygen Demand (COD)
| Unit | FY2021 | FY2022 | FY2023 | FY2024 | FY2025 | ||
| ITOCHU Group discharge amount into Water | BOD load |
t |
28,622 |
52,612 |
31,511 |
5,761 |
621 |
COD load |
t |
135,710 |
231,914 |
123,785 |
20,948 |
430 |
|
Chemical Oxygen Demand (COD)
| Category | Boundary | Unit | FY2021 | FY2022 | FY2023 | FY2024 | FY2025 |
| Chemical | C.I. TAKIRON Corporation (factory) |
mg/L |
2.80 |
1.50 |
1.67 |
1.60 |
1.80 |
Environmental Accounting
Environmental Conservation Costs
(Unit: thousands of yen)
| Classification | Items | FY2025 | ||
| Japanese Bases of ITOCHU Corporation | Costs inside Business Areas | Costs related to pollution prevention, global environmental conservation, and resource recycling |
168,882 |
|
| Upstream & Downstream Costs | Additional costs for reducing environmental impact, green procurement costs, and containers and packaging recycling. |
56,050 |
||
| (Green Procurement Costs) | 5,267 |
|||
| Management Activity Costs | Costs for the development and operation of environmental management systems and environmental education for employees |
583,716 |
||
| Research and Development Costs | R & D costs for products contributing to environmental conservation |
500 |
||
| Social Activity Costs | Costs for environmental improvement measures such as nature conservation, greening, beautification, and landscape preservation, as well as donations and support to organizations engaged in environmental conservation |
4,768 |
||
| Costs to Address Environmental Damage | Costs for nature restoration, compensation for damages related to environmental conservation, etc. |
440 |
||
| Grand Total of Japanese Bases of ITOCHU Corporation | 814,356 |
|||
- Summarized based on the Environmental Accounting Guidelines - 2005 Edition from the Ministry of the Environment
Environmental Conservation and Economic Effects
| FY2025 | |||
| Environmental Conservation Effects | Economic Effects (Unit: thousands of yen) |
||
| Japanese Bases of ITOCHU Corporation | Paper Usage | 1,901 thousand sheets |
1,024 |
| Electricity Usage | 41 MWh |
11,249 |
|
| Tokyo Headquarters | Waste Generated | -124 t |
-5,686 |
| Water Usage | -5,370 m3 |
-1,397 |
|
- Environmental conservation and economic effects are calculated by subtracting actual values for the current fiscal year from those for the previous fiscal year
Understanding the Situation of our Environmental Obligations
We do not limit ourselves to just supporting statutory requirements in regards to the environmental risks in the tangible fixed assets (e.g., land and buildings) of ITOCHU alone and our Group companies — in particular, asbestos, PCB and soil contamination; we also look to understand the situation through surveys voluntarily and then aim to respond in a way that is helpful to prompt management policy decisions and judgments. We estimate the cost of waste disposal at JPY 25 million, which is an estimable amount (shadow cost) for future environmental liabilities.
- Independent Assurance
- Basic Information
- Diversity
- Human Resources Development
- Occupational Health and Safety
Independent Assurance
The data below marked with ★ is independently assured by Deloitte Tohmatsu Sustainability Co., Ltd. This assurance is conducted in accordance with the International Standard on Assurance Engagements (ISAE) 3000 of the International Auditing and Assurance Standards Board (IAASB).
- Regarding range of tallied data, figures not labeled as Consolidated are placed under Non-Consolidated.
Basic Information
Employee Status (as of March 31 for each respective year)
| Non-Consolidated | Consolidated | ||||||
| Employees (people) | Men (people) | Women (people) | Avg. Age (years old) | Avg. Annual Salary (Yen)*1 | Employees (people)*2 | Temporary Staff (people)*3 | |
| 2026 |
★ 4,125 |
★ 3,046 (74%)*4 |
★ 1,079 (26%)*4 |
★ 42.0 |
★ 19,911,534 |
★ 114,570 |
★ 45,459 |
| 2025 | 4,114 |
3,061 (74%) |
1,053 (26%) |
42.2 |
18,045,578 |
115,089 |
46,080 |
| 2024 | 4,098 |
3,072 (75%) |
1,026 (25%) |
42.3 |
17,536,469 |
113,733 |
45,193 |
| 2023 | 4,112 |
3,111 (76%) |
1,001 (24%) |
42.4 |
17,300,799 |
110,698 |
44,705 |
| 2022 | 4,170 |
3,180 (76%) |
990 (24%) |
42.2 |
15,797,516 |
115,124 |
43,195 |
- The average annual salary, effective from 2024, is calculated excluding employees on leave and those on fixed-term contracts such as rehired retirees.
- The number of consolidated employees is the number of employees including subsidiaries (including seconded employees and excluding executives, seconded employees to other companies, and temporary employees).
- Temporary staff, including those from subsidiaries, are defined as temporary staff, contract employees, part-time workers, and part-timers with a contract period of one month or longer, and the number is calculated as [(the number of temporary staff at the beginning of FY) plus (the number of temporary staff at the end of FY) divided by 2] as the average number of temporary staff for each fiscal year.
- Only the number of people that is covered by the Independent Assurance.
Employees by Operating Segment★ (as of March 31, 2026)
(Unit: People)
| Textile | Machinery | Metals & Minerals |
Energy & Chemicals |
Food | General Products & Realty |
ICT & Financial Business |
The 8th | Others | Total | |
| Non- consolidated |
319 |
425 |
172 |
364 |
415 |
232 |
251 |
42 |
858 |
3,078 |
| Consolidated |
8,402 |
13,337 |
536 |
11,619 |
30,677 |
21,046 |
19,736 |
6,674 |
2,543 |
114,570 |
- The number of employees in each segment on the consolidated basis is the number of employees including subsidiaries (including seconded employees and excluding executives, seconded employees to other companies, and temporary employees).
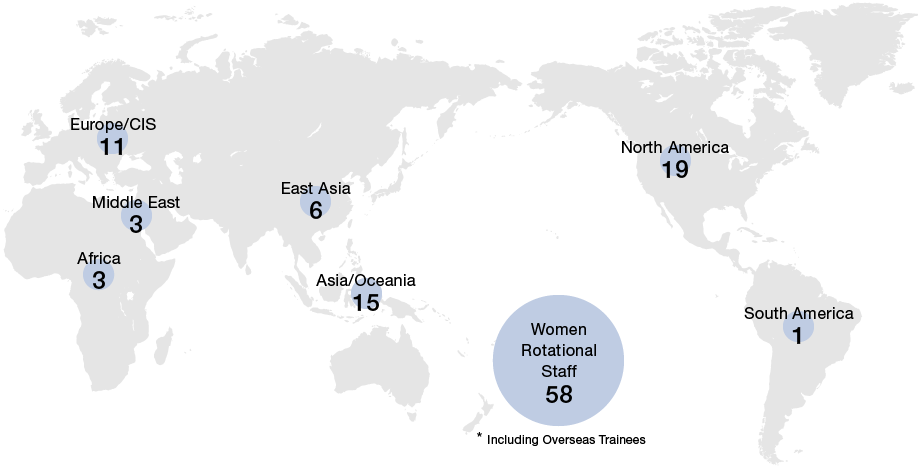
Overseas Bloc Employees by Region★ (as of March 31, 2026)
(Unit: People)
| North America | South America | Europe / CIS | Africa | Middle East | East Asia | Asia / Oceania | |
| National Staff |
131 |
110 |
257 |
63 |
110 |
547 |
586 |
| Rotational Staff |
58 |
21 |
59 |
17 |
24 |
62 |
108 |
| Overseas Trainees |
19 |
4 |
17 |
1 |
6 |
16 |
22 |
| Total |
208 |
135 |
333 |
81 |
140 |
625 |
716 |
- Overseas bloc employees by region counts employees who are assigned to overseas subsidiaries or overseas branches/offices.
Average Years Employed and Voluntary Resignation Rate (Non-Consolidated)
| FY2021 | FY2022 | FY2023 | FY2024 | FY2025 | ||
| Avg. Years Employed (Unit: years) | Men | 18years 1month |
18years 3months |
18years 2months |
18years 2months |
★ 18years 2months |
| Women | 18years 5months |
18years 3months |
18years 0month |
17years 5months |
★ 16years 7months |
|
| Total | 18years 2months |
18years 3months |
18years 2months |
18years 0month |
★ 17years 9months |
|
| Voluntary turnover Rate*1 | Men | 1.7% |
1.9% |
1.5% |
1.5% |
★ 1.6% |
| Women | 1.5% |
1.6% |
1.7% |
2.0% |
★ 1.8% |
|
| Total | 1.6% |
1.9% |
1.6% |
1.6% |
★ 1.7% |
|
| Voluntary turnover rate among new graduates within three years of hiring | 2.3% |
6.7% |
6.9% |
3.7% |
2.2% |
|
- Positions: career-track, business expert (BX), special
- Voluntary turnover rate is calculated as [(the number of employees who voluntary resigned) divided by (the number of employees at end of fiscal year)]
Working Hours & Annual Paid Leave
| FY2021 | FY2022 | FY2023 | FY2024 | FY2025 | |
| Annual paid leave acquisition rate | 61% |
63% |
66% |
69% |
71% |
| Annual average actual working hours | 2,127 |
2,098 |
2,092 |
2,075 |
2,029 |
| Monthly average overtime hours (Hours/Month)*1 | Approx. 16 |
Approx. 13 |
Approx. 12 |
Approx. 11 |
Approx. 10 |
- The figure adds up the portion of actual working hours that exceeds the statutory working hours of eight hours.
Diversity
Gender Pay-Gap
| All Employees | Full-time Employees | Part-time Employees | |
| FY2025*1 |
56.9% |
57.9% |
59.3% |
| FY2024*2 | 58.4% |
59.2% |
60.9% |
| FY2023 | 58.5% |
59.3% |
52.5% |
| FY2022 | 59.1% |
60.5% |
41.6% |
- The formula of the calculation is [(average women’s annual salary) divided by (average men’s annual salary)].
- Based on the special measure system for appointing female executive officers introduced in FY2023, the total of 10 female executive officers appointed as of April 1, 2024, and April 1, 2025, are included in the employee count.
- Based on the special measure system for appointing female executive officers introduced in FY2023, the five female executive officers appointed as of April 1, 2024, are included in the employee count.
Number of Hires by Gender and Adoption Rate for Mid-Career
| Number of Hires by Gender (Unit:People) | Adoption Rate for Mid-Career (Unit:%) | |||||||
| New-Graduates | Mid-Career | Total | ||||||
| Men | Women | Total | Men | Women | Total | |||
| FY2025★ |
89 |
64 |
153 |
20 |
6 |
26 |
179 |
15 |
| FY2024 | 95 |
60 |
155 |
22 |
5 |
27 |
182 |
15 |
| FY2023 | 82 |
53 |
135 |
19 |
5 |
24 |
159 |
15 |
| FY2022 | 73 |
34 |
107 |
8 |
6 |
14 |
121 |
12 |
| FY2021 | 80 |
36 |
116 |
1 |
1 |
2 |
118 |
2 |
- The scope of the period is fiscal year (1st of April - End of March).
Share of Women in Career-track / Managerial / General Managerial / Executive Positions
(as of March 31 for each Respective Year)
(Unit: People)
| Career-track | Managerial*1 | General Managerial*2 | Executive Positions*3 | |||||||||
| Total | Women | Share | Total | Women | Share | Total | Women | Share | Total | Women | Share | |
| 2026★ |
3,332 |
443 |
13.3% |
2,573 |
261 |
10.1% |
378 |
10 |
2.7% |
53 |
15 |
28.3% |
| 2025 | 3,318 |
416 |
12.5% |
2,542 |
229 |
9.0% |
394 |
6 |
1.5% |
47 |
10 |
21.3% |
| 2024 | 3,308 |
395 |
11.9% |
2,522 |
223 |
8.8% |
392 |
3 |
0.8% |
41 |
5 |
12.2% |
| 2023 | 3,331 |
375 |
11.3% |
2,541 |
219 |
8.6% |
401 |
3 |
0.7% |
38 |
4 |
10.5% |
| 2022 | 3,395 |
359 |
10.6% |
2,569 |
210 |
8.2% |
413 |
3 |
0.7% |
41 |
4 |
9.8% |
- "Managerial" includes those in general positions above a certain rank, as well as special positions equivalent to managerial roles and associate executive officers.
In the figures for managers from 2025 onward, female executive officers appointed under the special measure system for appointing female executive officers introduced in FY2023 are included in the employee count. - “General Managerial” includes employees in higher managerial roles, and also includes executive officers and associate executive officers.
- In accordance with the revision of the personnel system for executive officers, we have reviewed part of the aggregation criteria. Consequently, the numbers and ratios for 2023 and 2022 have been retroactively corrected.
Women Rotational Staff (as of April 1, 2026)
Use of Childcare & Nursing Care Programs
Childcare
(Unit: People)
| Childcare leave*1 | Childcare leave acquisition rate*2 | Leave to nurse sick children | Shorter working hours for childcare | Special parental leave | Percentage of employees returning to work*3 | ||
| FY2025★ | Men |
108 |
128% |
133 |
0 |
2 |
96% |
| Women |
37 |
103% |
165 |
87 |
27 |
||
| Total |
145 |
121% |
298 |
87 |
29 |
||
| FY2024 | Men | 75 |
96% |
109 |
0 |
4 |
100% |
| Women | 38 |
103% |
139 |
80 |
23 |
||
| Total | 113 |
98% |
248 |
80 |
27 |
||
| FY2023 | Men | 51 |
53% |
102 |
0 |
5 |
96% |
| Women | 45 |
100% |
145 |
74 |
22 |
||
| Total | 96 |
68% |
247 |
74 |
27 |
||
| FY2022 | Men | 39 |
52% |
67 |
0 |
4 |
96% |
| Women | 48 |
100% |
125 |
89 |
19 |
||
| Total | 87 |
71% |
192 |
89 |
23 |
||
| FY2021 | Men | 32 |
34% |
71 |
0 |
7 |
100% |
| Women | 47 |
104% |
124 |
94 |
16 |
||
| Total | 79 |
56% |
195 |
94 |
23 |
||
- Childcare leave includes childcare leave at birth (postpartum paternity leave) and leave for childcare purposes. Family support leave has been included from FY2025 onward.
- The “Childcare leave acquisition rate” is the ratio of the number of employees who started taking parental leave during the fiscal year to the number of employees who gave birth during the fiscal year (For men, the number of male employees whose spouses gave birth). (Including the number of employees seconded from other companies)
- The percentage of employees (including those seconded to other companies) returning to work after childcare leave is calculated according to the following formula: the number of employees returning to work after childcare leave during the current fiscal year/the number of employees who finished taking childcare leave during the current fiscal year.
Nursing Care and Family Support Leave
(Unit: People)
| Nursing care leave | Leave for nursing care | Shorter working hours for nursing care | Special nursing care leave | Family Support Leave | ||
| FY2025★ | Men |
0 |
29 |
0 |
5 |
66 |
| Women |
0 |
50 |
3 |
6 |
84 |
|
| Total |
0 |
79 |
3 |
11 |
150 |
|
| FY2024 | Men | 0 |
29 |
0 |
4 |
48 |
| Women | 1 |
40 |
4 |
7 |
78 |
|
| Total | 1 |
69 |
4 |
11 |
126 |
|
| FY2023 | Men | 0 |
32 |
0 |
3 |
49 |
| Women | 0 |
49 |
3 |
9 |
73 |
|
| Total | 0 |
81 |
3 |
12 |
122 |
|
| FY2022 | Men | 0 |
23 |
0 |
4 |
55 |
| Women | 0 |
45 |
3 |
9 |
70 |
|
| Total | 0 |
68 |
3 |
13 |
125 |
|
| FY2021 | Men | 1 |
18 |
0 |
3 |
70 |
| Women | 0 |
47 |
5 |
9 |
72 |
|
| Total | 1 |
65 |
5 |
12 |
142 |
|
Employment of Disabled Persons
(as of March 1 for each Respective Year)
| Percentage of Disabled Employees (%) | |
| 2026★ | 2.66 |
| 2025 |
2.42 |
| 2024 | 2.43 |
| 2023 | 2.48 |
| 2022 | 2.43 |
- ITOCHU Corporation, ITOCHU UNIDAS Co., Ltd. and ITOCHU Human Resources & General Services Co., Ltd are included in the scope of the figure.
Number of Overseas Local Employee Management Personnel (as of March 31, 2026)
(Unit: People)
| North America | South America | Europe / CIS | Africa | Middle East | East Asia | Asia / Oceania | |
| Management Personnel | 85 |
35 |
79 |
9 |
28 |
343 |
196 |
- Equivalent to headquarters management positions
Workshops on Diversity, Equity & Inclusion
| Fiscal Year | Theme |
| FY2025 (Offline・Online) |
|
| FY2024 (Offline・Online) |
|
| FY2023 (Offline・Online) |
|
Human Resources Development
Time/Cost Allotted for Employee Skills Development Training
| FY2021 | FY2022 | FY2023 | FY2024 | FY2025 | |
| Total annual training time (hours) | 112,574 | 87,841 | 115,649 | 125,055 | 120,793 |
| FY2021 | FY2022 | FY2023 | FY2024 | FY2025 | |
| Average training/development hours per regular employee (hours)*1 | 27.0 | 21.4 | 28.2 | 31.0 | 29.8 |
| Average training/development cost per regular employee (thousand yen) | 269 | 396 | 555 | 606 | 66.4 |
- Calculation method: [(total annual training hours) divided by (employees at end of fiscal year, excluding employees on administration leave for FY2024)]
Attendance in Major Training
(Unit: People)
| Training | FY2021 | FY2022 | FY2023 | FY2024 | FY2025 |
| Quick Mastering Business Management Course | 172 | 173 | 145 | 167 | 187 |
| Global Development Program | 0 (Not implemented) | 33 | 102 | 102 | 95 |
| Organization Manager Workshop | 624 | 1,401 | 649 | 701 | 717 |
| Short-Term Business School Dispatch | 7 | 16 | 36 | 37 | 39 |
| Junior Chinese/Special Language Dispatch | 0 (Not implemented) | 5 | 15 | 13 | 14 |
| Chinese Lessons | 189 | 193 | 233 | 203 | 217 |
| Career Vision Support Training (total) | 1,851 | 1,419 | 1,210 | 1,458 | 988 |
FY2025 Human Rights Training Record★
(Unit: People)
| Number of Participants | |
| Group ESG Managers Conference |
90 |
| New Employee Training |
155 |
| Training for Newly Appointed Section Managers |
53 |
| Organization Manager Workshop |
717 |
| Pre-overseas Appointment Training |
221 |
| Training for New Officers of Group Companies |
95 |
| Sustainability Survey Workshop |
85 |
| Total |
1,416 |
Occupational Health and Safety
Occupational Health and Safety Data (Non-Consolidated Employees)
| FY2021 | FY2022 | FY2023 | FY2024 | FY2025★ | ||||||
| Employees | Contractors | Employees | Contractors | Employees | Contractors | Employees | Contractors | Employees | Contractors | |
| Number who Suffered from Occupational Accidents (Number which Occurred During Commute)*1 | 5 (4) |
0 (0) |
3 (0) |
0 (0) |
5 (3) |
3 (1) |
7 (5) |
2 (0) |
10 (6) |
0 |
| Number of Fatalities | 0 |
0 |
0 |
0 |
0 |
0 |
0 |
0 |
0 |
0 |
| OIFR (Occupational Illness Frequency Rate)*2 | 0 |
0 |
0 |
0 |
0 |
0 |
0 |
0 |
0 |
0 |
| Number who Suffered Lost Time Incidents (LTI)*3 | 0 |
0 |
0 |
0 |
0 |
1 |
0 |
1 |
1 |
0 |
| LTIFR (Lost Time Injury Frequency Rate)*4 | 0 |
0 |
0 |
0 |
0 |
4.91 |
0 |
3.76 |
0 |
0 |
- Employees targeted: Employees — Full-time career-track employees, business expert (BX) employees, those in special positions and employees temporarily assigned to us. Contractors — contract employees (including Part-time employees)
- Number who suffered from occupational accidents: The total number of those who suffered from of occupational accidents or non-LTI due to their work and those injured during their commute. The breakdown of the number of workplace accidents is as follows: 9 falls and 1 other.
To prevent falls and other accidents during commuting, safety reminders are issued on the company's intranet during inclement weather. - OIFR: The rate of incidence of lost-time accidents corresponding to disease per million hours [calculated as (the number of people suffering from LTI due to illness) divided by (the total number of working hours) then multiplied by one million hours.]
- We define Lost time injuries (LTI) as incidents where a work-related injury or illness causes the victim to be absent from work on the next working day.
If the employee took a leave of absence after the next working day, it is not included in the aggregation. - LTIFR: The rate of occurrence of incidents that caused employees to miss work per million working hours [calculated as (the number of sufferers of LTI) divided by (the total number of working hours), then multiplied by 1 million hours]
Performance Benchmarking Against Industry Average (Wholesalers and Retailers with Over 100 Employees)
| FY2021 | FY2022 | FY2023 | FY2024 | FY2025 | |
| Lost-time Incident Rate | 2.31 |
1.98 |
2.43 |
2.60 |
- The data above references the Ministry of Health, Labor and Welfare’s FY2024 Research on Work-related Accident Trends
Attendance in Training Related to Health and Safety Standards (Non-Consolidated Employees)
(Unit: People)
| FY2021 | FY2022 | FY2023 | FY2024 | FY2025 | |
| General Training Covering Health and Safety Standards*1 | 841 |
2,690 |
2,865 |
2,815 |
★ 2,984 |
| Human Resources-led Training Covering Health and Safety Standards*2 | 63 |
358 |
719 |
498 |
★ 47 |
- The total number of participants in training new recruits (career-track employees and business expert (BX) employees), training for newly appointed section managers, training in preparation for overseas assignments, and the comprehensive emergency drill at the Tokyo headquarters.
- The total number of participants in Career vision training (including mindfulness courses and mental health management courses).
FY2025 Number of Employees that Received Our Main Health and Safety-related Trainings
(Unit: People)
| Type of Training | Training Details | Number of Employee Attendees |
| Training New Recruits | Employees newly joining ITOCHU are informed on the importance of health for their personal life and their career. The training includes information on mental health and lifestyle-related diseases. Employees are also educated on the company’s health and safety management by our occupational physician and our clinical psychologist. |
155 |
| New Manager Training on Health Management | For newly promoted junior managers, industrial physicians and clinical psychologists provide training on how to guide and manage the health and safety of subordinates through case-studies. The training also provides guidance on how to maintain one’s own health once promoted to their new positions. |
53 |
| Training in Preparation for Overseas Assignments or Junior Overseas Training | The training is mainly conducted by our occupational physician, and covers health issues that are likely to occur in relevant countries, as well as crucial differences in medical environments and lifestyles between Japan and assigned countries. The training also covers necessary preparations that are recommended prior to dispatch, and information on how to receive health checkups during their assignment. We also provide the same training for the family members of our employees, and provide information on key contact points and resources in case of emergencies. |
608 |